- Essentials
- Getting Started
- Datadog
- Datadog Site
- DevSecOps
- Serverless for AWS Lambda
- Agent
- Integrations
- Containers
- Dashboards
- Monitors
- Logs
- APM Tracing
- Profiler
- Tags
- API
- Service Catalog
- Session Replay
- Continuous Testing
- Synthetic Monitoring
- Incident Management
- Database Monitoring
- Cloud Security Management
- Cloud SIEM
- Application Security Management
- Workflow Automation
- CI Visibility
- Test Visibility
- Test Impact Analysis
- Code Analysis
- Learning Center
- Support
- Glossary
- Standard Attributes
- Guides
- Agent
- Integrations
- OpenTelemetry
- Developers
- Authorization
- DogStatsD
- Custom Checks
- Integrations
- Create an Agent-based Integration
- Create an API Integration
- Create a Log Pipeline
- Integration Assets Reference
- Build a Marketplace Offering
- Create a Tile
- Create an Integration Dashboard
- Create a Recommended Monitor
- Create a Cloud SIEM Detection Rule
- OAuth for Integrations
- Install Agent Integration Developer Tool
- Service Checks
- IDE Plugins
- Community
- Guides
- API
- Datadog Mobile App
- CoScreen
- Cloudcraft
- In The App
- Dashboards
- Notebooks
- DDSQL Editor
- Sheets
- Monitors and Alerting
- Infrastructure
- Metrics
- Watchdog
- Bits AI
- Service Catalog
- API Catalog
- Error Tracking
- Service Management
- Infrastructure
- Application Performance
- APM
- Continuous Profiler
- Database Monitoring
- Data Streams Monitoring
- Data Jobs Monitoring
- Digital Experience
- Real User Monitoring
- Product Analytics
- Synthetic Testing and Monitoring
- Continuous Testing
- Software Delivery
- CI Visibility
- CD Visibility
- Test Optimization
- Code Analysis
- Quality Gates
- DORA Metrics
- Security
- Security Overview
- Cloud SIEM
- Cloud Security Management
- Application Security Management
- AI Observability
- Log Management
- Observability Pipelines
- Log Management
- Administration
Google Cloud Platform
Overview
Connect to Google Cloud Platform to see all your Google Compute Engine (GCE) hosts in Datadog. You can see your hosts in the infrastructure overview in Datadog and sort through them, since Datadog automatically tags them with GCE host tags and any GCE labels you may have added.
Datadog's GCP integration is built to collect all Google Cloud metrics. Datadog strives to continually update the docs to show every sub-integration, but cloud services rapidly release new metrics and services so the list of integrations are sometimes lagging.
| Integration | Description |
|---|---|
| App Engine | PaaS (platform as a service) to build scalable applications |
| Big Query | Enterprise data warehouse |
| Bigtable | NoSQL Big Data database service |
| Cloud SQL | MySQL database service |
| Cloud APIs | Programmatic interfaces for all Google Cloud Platform services |
| Cloud Armor | Network security service to help protect against denial of service and web attacks |
| Cloud Composer | A fully managed workflow orchestration service |
| Cloud Dataproc | A cloud service for running Apache Spark and Apache Hadoop clusters |
| Cloud Dataflow | A fully-managed service for transforming and enriching data in stream and batch modes |
| Cloud Filestore | High-performance, fully managed file storage |
| Cloud Firestore | A flexible, scalable database for mobile, web, and server development |
| Cloud Interconnect | Hybrid connectivity |
| Cloud IoT | Secure device connection and management |
| Cloud Load Balancing | Distribute load-balanced compute resources |
| Cloud Logging | Real-time log management and analysis |
| Cloud Memorystore for Redis | A fully managed in-memory data store service |
| Cloud Router | Exchange routes between your VPC and on-premises networks by using BGP |
| Cloud Run | Managed compute platform that runs stateless containers through HTTP |
| Cloud Security Command Center | Security Command Center is a threat reporting service. |
| Cloud Tasks | Distributed task queues |
| Cloud TPU | Train and run machine learning models |
| Compute Engine | High performance virtual machines |
| Container Engine | Kubernetes, managed by google |
| Datastore | NoSQL database |
| Firebase | Mobile platform for application development |
| Functions | Serverless platform for building event-based microservices |
| Kubernetes Engine | Cluster manager and orchestration system |
| Machine Learning | Machine learning services |
| Private Service Connect | Access managed services with private VPC connections |
| Pub/Sub | Real-time messaging service |
| Spanner | Horizontally scalable, globally consistent, relational database service |
| Storage | Unified object storage |
| Vertex AI | Build, train and deploy custom machine learning (ML) models. |
| VPN | Managed network functionality |
Setup
Set up Datadog’s Google Cloud integration to collect metrics and logs from your Google Cloud services.
Prerequisites
If your organization restricts identities by domain, you must add Datadog’s customer identity as an allowed value in your policy. Datadog’s customer identity:
C0147pk0iService account impersonation and automatic project discovery relies on you having certain roles and APIs enabled to monitor projects. Before you start, ensure the following APIs are enabled for each of the projects you want to monitor:
- Cloud Resource Manager API
- Google Cloud Billing API
- Cloud Monitoring API
- Compute Engine API
- Cloud Asset API
- IAM API
- Ensure that any projects being monitored are not configured as scoping projects that pull in metrics from multiple other projects.
Metric collection
Installation
The Datadog Google Cloud integration for the site uses service accounts to create an API connection between Google Cloud and Datadog. Follow the instructions below to create a service account and provide Datadog with the service account credentials to begin making API calls on your behalf.
Service account impersonation is not available for the site.
Note: Google Cloud billing, the Cloud Monitoring API, the Compute Engine API, and the Cloud Asset API must all be enabled for any projects you wish to monitor.
Go to the Google Cloud credentials page for the Google Cloud project you want to integrate with Datadog.
Click Create credentials.
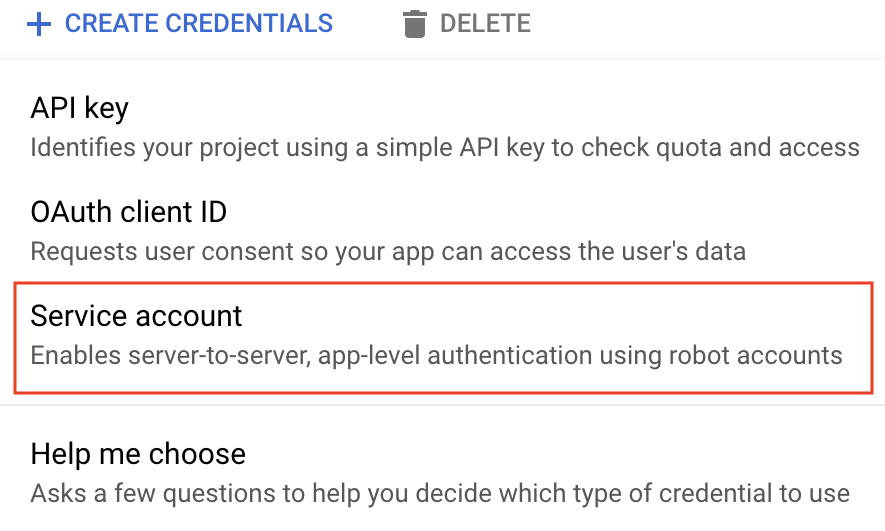
Select Service account.
Give the service account a unique name and optional description.
Click Create and continue.
Add the following roles:
- Compute Viewer
- Monitoring Viewer
- Cloud Asset Viewer
Click Done. Note: You must be a Service Account Key Admin to select Compute Engine and Cloud Asset roles. All selected roles allow Datadog to collect metrics, tags, events, and user labels on your behalf.
At the bottom of the page, find your service accounts and select the one you just created.
Click Add Key -> Create new key, and choose JSON as the type.
Click Create. A JSON key file is downloaded to your computer. Note where it is saved, as it is needed to complete the installation.
Navigate to the Datadog Google Cloud Integration page.
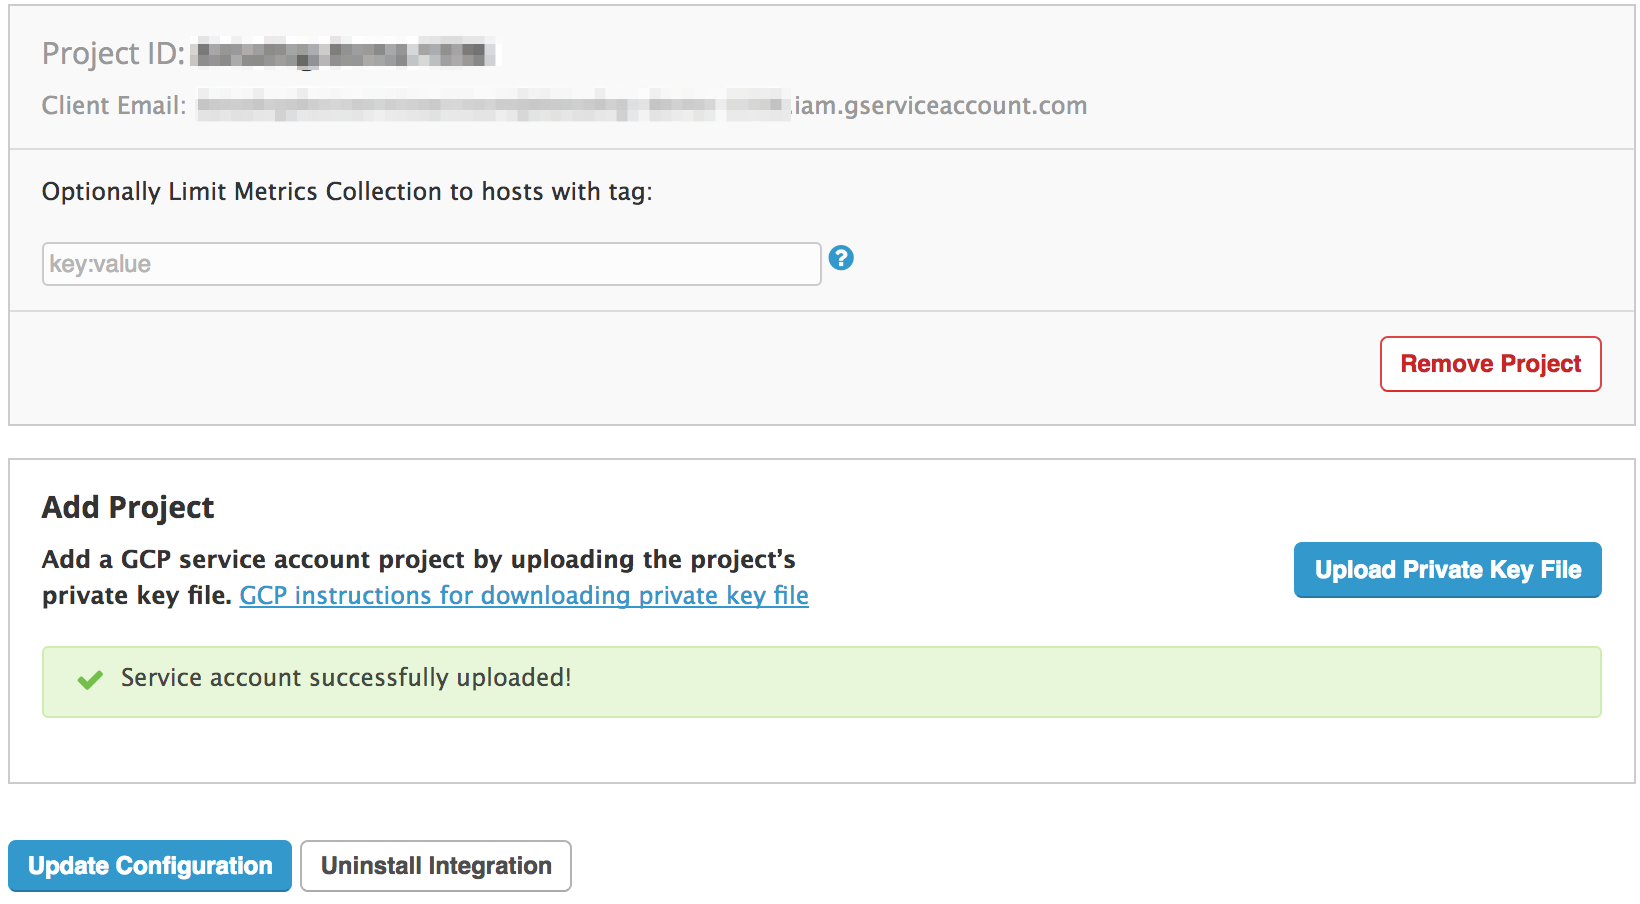
On the Configuration tab, select Upload Key File to integrate this project with Datadog.
Optionally, you can use tags to filter out hosts from being included in this integration. Detailed instructions on this can be found in the configuration section.
Click Install/Update.
If you want to monitor multiple projects, use one of the following methods:
- Repeat the process above to use multiple service accounts.
- Use the same service account by updating the
project_idin the JSON file downloaded in step 10. Then upload the file to Datadog as described in steps 11-14.
Configuration
Optionally, you can limit the GCE instances that are pulled into Datadog by entering tags in the Limit Metric Collection textbox under a given project’s dropdown menu. Only hosts that match one of the defined tags are imported into Datadog. You can use wildcards (? for single character, * for multi-character) to match many hosts, or ! to exclude certain hosts. This example includes all c1* sized instances, but excludes staging hosts:
datadog:monitored,env:production,!env:staging,instance-type:c1.*
See Google’s documentation on Creating and managing labels for more details.
You can use service account impersonation and automatic project discovery to integrate Datadog with Google Cloud.
This method enables you to monitor all projects visible to a service account by assigning IAM roles in the relevant projects. You can assign these roles to projects individually, or you can configure Datadog to monitor groups of projects by assigning these roles at the organization or folder level. Assigning roles in this way allows Datadog to automatically discover and monitor all projects in the given scope, including any new projects that may be added to the group in the future.
1. Create your Google Cloud service account
- Open your Google Cloud console.
- Navigate to IAM & Admin > Service Accounts.
- Click on Create service account at the top.
- Give the service account a unique name, then click Create and continue.
- Add the following roles to the service account:
- Monitoring Viewer
- Compute Viewer
- Cloud Asset Viewer
- Browser
- Click Continue, then Done to complete creating the service account.
2. Add the Datadog principal to your service account
In Datadog, navigate to the Integrations > Google Cloud Platform.
Click on Add GCP Account. If you have no configured projects, you are automatically redirected to this page.
If you have not generated a Datadog principal for your org, click the Generate Principal button.
Copy your Datadog principal and keep it for the next section.
**Note:** Keep this window open for the next section.In Google Cloud console, under the Service Accounts menu, find the service account you created in the first section.
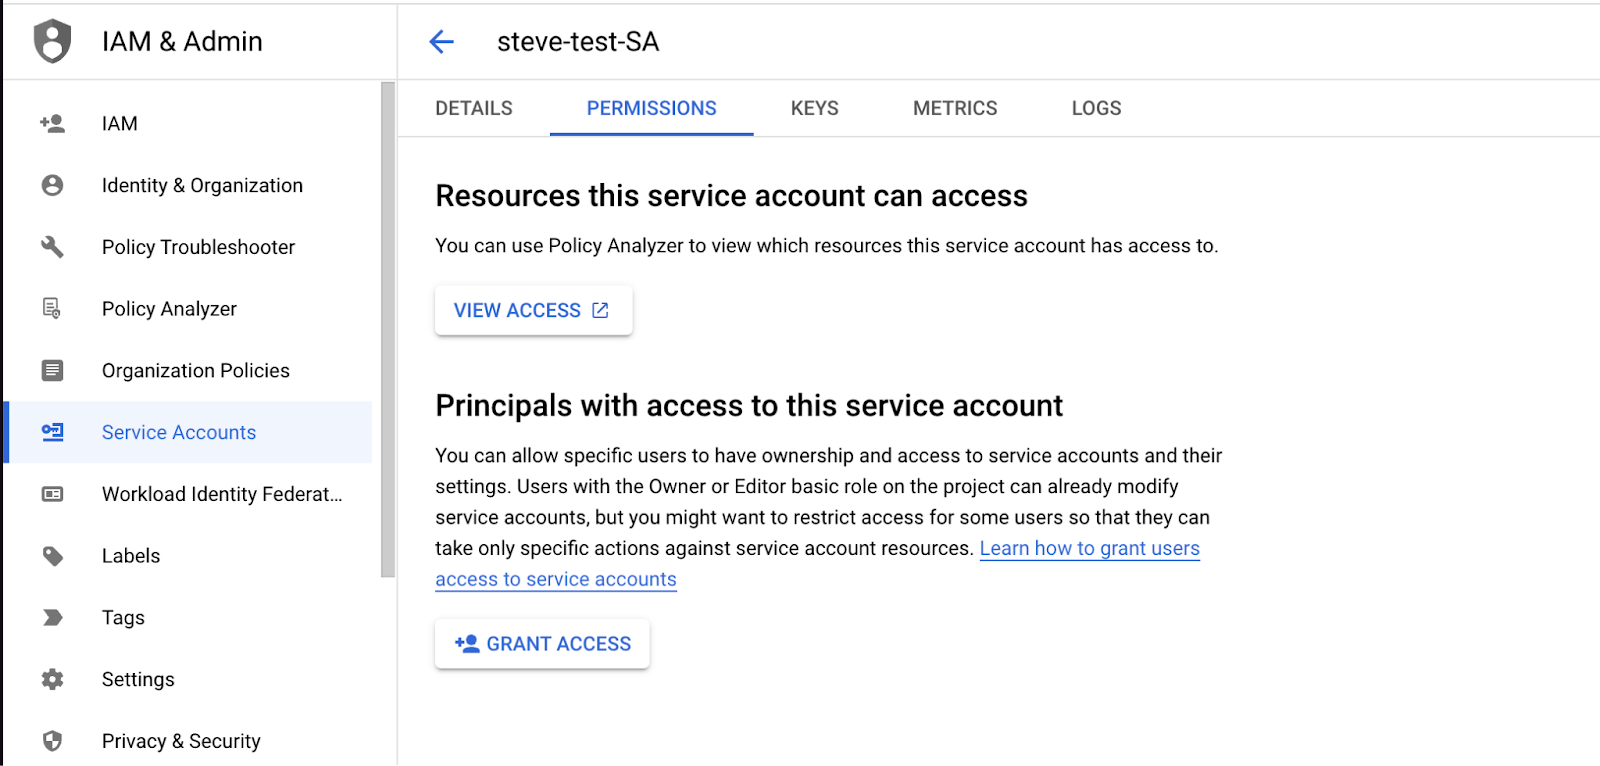
Go to the Permissions tab and click on Grant Access.
Paste your Datadog principal into the New principals text box.
Assign the role of Service Account Token Creator and click Save.
Note: If you previously configured access using a shared Datadog principal, you can revoke the permission for that principal after you complete these steps.
3. Complete the integration setup in Datadog
- In your Google Cloud console, navigate to the Service Account > Details tab. There, you can find the email associated with this Google service account. It resembles
<sa-name>@<project-id>.iam.gserviceaccount.com. - Copy this email.
- Return to the integration configuration tile in Datadog (where you copied your Datadog principal in the previous section).
- In the box under Add Service Account Email, paste the email you previously copied.
- Click on Verify and Save Account.
In approximately fifteen minutes, metrics appear in Datadog.
4. Assign roles to other projects (optional)
Automatic project discovery simplifies the process of adding additional projects to be monitored. If you grant your service account access to other projects, folders, or orgs, Datadog discovers these projects (and any projects nested in the folders or orgs) and automatically adds them to your integration tile.
- Make sure you have the appropriate permissions to assign roles at the desired scope:
- Project IAM Admin (or higher)
- Folder Admin
- Organization Admin
- In the Google Cloud console, go to the IAM page.
- Select a project, folder, or organization.
- To grant a role to a principal that does not already have other roles on the resource, click Grant Access, then enter the email of the service account you created earlier.
- Assign the following roles:
- Compute Viewer
- Monitoring Viewer
- Cloud Asset Viewer Note: The Browser role is only required in the default project of the service account.
- Click Save.
Configuration
Optionally, you can limit the GCE instances that are pulled into Datadog by entering tags in the Limit Metric Collection textbox under a given project’s dropdown menu. Only hosts that match one of the defined tags are imported into Datadog. You can use wildcards (? for single character, * for multi-character) to match many hosts, or ! to exclude certain hosts. This example includes all c1* sized instances, but excludes staging hosts:
datadog:monitored,env:production,!env:staging,instance-type:c1.*
See Google’s documentation on Creating and managing labels for more details.
Log collection
Forward logs from your Google Cloud services to Datadog using Google Cloud Dataflow and the Datadog template. This method provides both compression and batching of events before forwarding to Datadog. Follow the instructions in this section to:
- Create a Pub/Sub topic and pull subscription to receive logs from a configured log sink
- Create a custom Dataflow worker service account to provide least privilege to your Dataflow pipeline workers
- Create a log sink to publish logs to the Pub/Sub topic
- Create a Dataflow job using the Datadog template to stream logs from the Pub/Sub subscription to Datadog
You have full control over which logs are sent to Datadog through the logging filters you create in the log sink, including GCE and GKE logs. See Google’s Logging query language page for information about writing filters.
Note: You must enable the Dataflow API to use Google Cloud Dataflow. See Enabling APIs in the Google Cloud documentation for more information.
To collect logs from applications running in GCE or GKE, you can also use the Datadog Agent.
1. Create a Cloud Pub/Sub topic and subscription
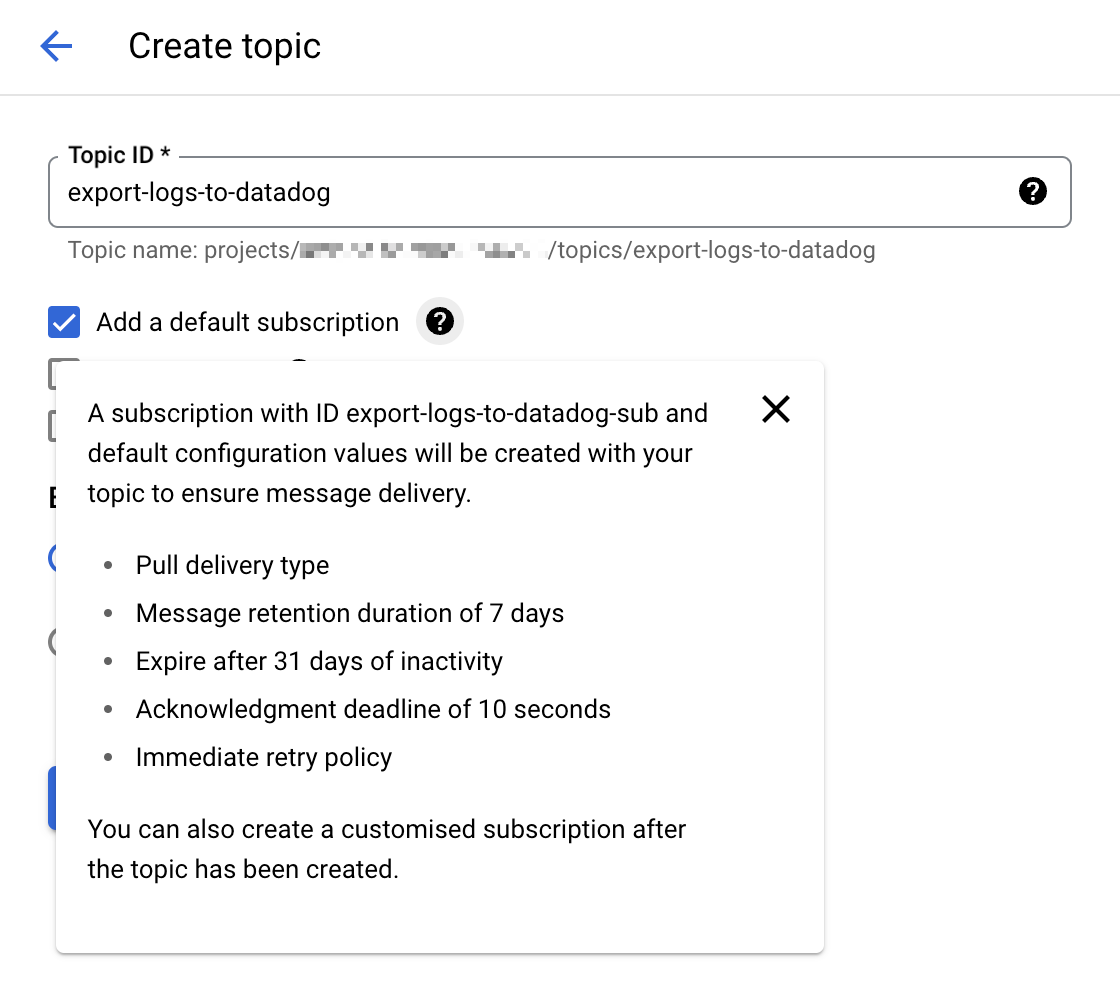
Go to the Cloud Pub/Sub console and create a new topic. Select the option Add a default subscription to simplify the setup.
Note: You can also manually configure a Cloud Pub/Sub subscription with the Pull delivery type. If you manually create your Pub/Sub subscription, leave the
Enable dead letteringbox unchecked. For more details, see Unsupported Pub/Sub features.
Give that topic an explicit name such as
export-logs-to-datadogand click Create.Create an additional topic and default subscription to handle any log messages rejected by the Datadog API. The name of this topic is used within the Datadog Dataflow template as part of the path configuration for the
outputDeadletterTopictemplate parameter. When you have inspected and corrected any issues in the failed messages, send them back to the originalexport-logs-to-datadogtopic by running a Pub/Sub to Pub/Sub template job.Datadog recommends creating a secret in Secret Manager with your valid Datadog API key value, for later use in the Datadog Dataflow template.
Warning: Cloud Pub/Subs are subject to Google Cloud quotas and limitations. If the number of logs you have exceeds those limitations, Datadog recommends you split your logs over several topics. See the Monitor the Pub/Sub Log Forwarding section for information on setting up monitor notifications if you approach those limits.
2. Create a custom Dataflow worker service account
The default behavior for Dataflow pipeline workers is to use your project’s Compute Engine default service account, which grants permissions to all resources in the project. If you are forwarding logs from a Production environment, you should instead create a custom worker service account with only the necessary roles and permissions, and assign this service account to your Dataflow pipeline workers.
- Go to the Service Accounts page in the Google Cloud console and select your project.
- Click CREATE SERVICE ACCOUNT and give the service account a descriptive name. Click CREATE AND CONTINUE.
- Add the roles in the required permissions table and click DONE.
Required permissions
- Dataflow Admin
roles/dataflow.admin
Allow this service account to perform Dataflow administrative tasks.- Dataflow Worker
roles/dataflow.worker
Allow this service account to perform Dataflow job operations.- Pub/Sub Viewer
roles/pubsub.viewer
Allow this service account to view messages from the Pub/Sub subscription with your Google Cloud logs.- Pub/Sub Subscriber
roles/pubsub.subscriber
Allow this service account to consume messages from the Pub/Sub subscription with your Google Cloud logs.- Pub/Sub Publisher
roles/pubsub.publisher
Allow this service account to publish failed messages to a separate subscription, which allows for analysis or resending the logs.- Secret Manager Secret Accessor
roles/secretmanager.secretAccessor
Allow this service account to access the Datadog API key in Secret Manager.- Storage Object Admin
roles/storage.objectAdmin
Allow this service account to read and write to the Cloud Storage bucket specified for staging files.
Note: If you don’t create a custom service account for the Dataflow pipeline workers, ensure that the default Compute Engine service account has the required permissions above.
3. Export logs from Google Cloud Pub/Sub topic
Go to the Logs Explorer page in the Google Cloud console.
From the Log Router tab, select Create Sink.
Provide a name for the sink.
Choose Cloud Pub/Sub as the destination and select the Cloud Pub/Sub topic that was created for that purpose. Note: The Cloud Pub/Sub topic can be located in a different project.
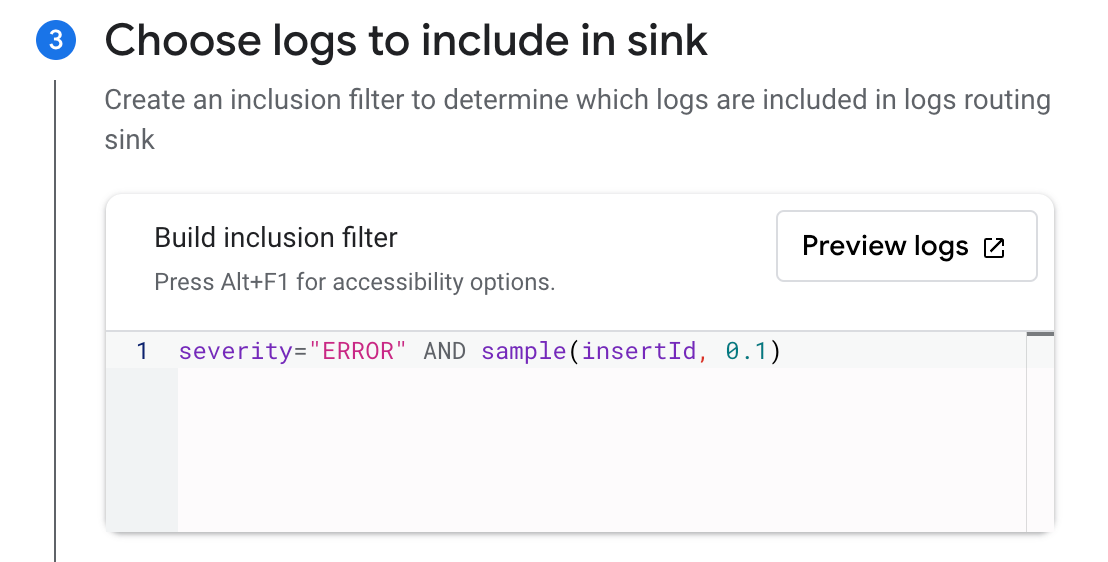
Choose the logs you want to include in the sink with an optional inclusion or exclusion filter. You can filter the logs with a search query, or use the sample function. For example, to include only 10% of the logs with a
severitylevel ofERROR, create an inclusion filter withseverity="ERROR" AND sample(insertId, 0.1).Click Create Sink.
Note: It is possible to create several exports from Google Cloud Logging to the same Cloud Pub/Sub topic with different sinks.
4. Create and run the Dataflow job
Go to the Create job from template page in the Google Cloud console.
Give the job a name and select a Dataflow regional endpoint.
Select
Pub/Sub to Datadogin the Dataflow template dropdown, and the Required parameters section appears. a. Select the input subscription in the Pub/Sub input subscription dropdown. b. Enter the following in the Datadog Logs API URL field:https://
Note: Ensure that the Datadog site selector on the right of the page is set to your Datadog site before copying the URL above.
c. Select the topic created to receive message failures in the Output deadletter Pub/Sub topic dropdown. d. Specify a path for temporary files in your storage bucket in the Temporary location field.
Under Optional Parameters, check
Include full Pub/Sub message in the payload.If you created a secret in Secret Manager with your Datadog API key value as mentioned in step 1, enter the resource name of the secret in the Google Cloud Secret Manager ID field.
See Template parameters in the Dataflow template for details on using the other available options:
apiKeySource=KMSwithapiKeyKMSEncryptionKeyset to your Cloud KMS key ID andapiKeyset to the encrypted API key- Not recommended:
apiKeySource=PLAINTEXTwithapiKeyset to the plaintext API key
- If you created a custom worker service account, select it in the Service account email dropdown.
- Click RUN JOB.
Note: If you have a shared VPC, see the Specify a network and subnetwork page in the Dataflow documentation for guidelines on specifying the Network and Subnetwork parameters.
Validation
New logging events delivered to the Cloud Pub/Sub topic appear in the Datadog Log Explorer.
Note: You can use the Google Cloud Pricing Calculator to calculate potential costs.
Monitor the Cloud Pub/Sub log forwarding
The Google Cloud Pub/Sub integration provides helpful metrics to monitor the status of the log forwarding:
gcp.pubsub.subscription.num_undelivered_messagesfor the number of messages pending deliverygcp.pubsub.subscription.oldest_unacked_message_agefor the age of the oldest unacknowledged message in a subscription
Use the metrics above with a metric monitor to receive alerts for the messages in your input and deadletter subscriptions.
Monitor the Dataflow pipeline
Use Datadog’s Google Cloud Dataflow integration to monitor all aspects of your Dataflow pipelines. You can see all your key Dataflow metrics on the out-of-the-box dashboard, enriched with contextual data such as information about the GCE instances running your Dataflow workloads, and your Pub/Sub throughput.
You can also use a preconfigured Recommended Monitor to set up notifications for increases in backlog time in your pipeline. For more information, read Monitor your Dataflow pipelines with Datadog in the Datadog blog.
Pub/Sub Push Method (Legacy)
Collecting Google Cloud logs with a Pub/Sub Push subscription is in the process of being deprecated.
The above documentation for the Push subscription is only maintained for troubleshooting or modifying legacy setups.
Use a Pull subscription with the Datadog Dataflow template as described under Dataflow Method to forward your Google Cloud logs to Datadog instead.
Resource change collection
Join the Beta!
Resource change collection is in private beta, but you can easily request access! Use this form to submit your request today.
Request AccessReceive resource events in Datadog when Google’s Cloud Asset Inventory detects changes in your cloud resources.
Ensure that you have selected Enable Resource Collection in the Resource Collection tab of the Google Cloud integration page. Then, follow the steps below to forward change events from a Pub/Sub topic to the Datadog Event Explorer.
Create a Cloud Pub/Sub topic and subscription
Create a topic
- In the Google Cloud Pub/Sub topics page, click CREATE TOPIC.
- Give the topic a descriptive name.
- Uncheck the option to add a default subscription.
- Click CREATE.
Create a subscription
- In the Google Cloud Pub/Sub subscriptions page, click CREATE SUBSCRIPTION.
- Enter
export-asset-changes-to-datadogfor the subscription name. - Select the Cloud Pub/Sub topic previously created.
- Select Pull as the delivery type.
- Click CREATE.
Grant access
To read from this Pub/Sub subscription, the Google Cloud service account used by the integration needs the pubsub.subscriptions.consume permission for the subscription. A default role with minimal permissions that allows this is the Pub/Sub subscriber role. Follow the steps below to grant this role:
- In the Google Cloud Pub/Sub subscriptions page, click the
export-asset-changes-to-datadogsubscription. - In the info panel on the right of the page, click the Permissions tab. If you don’t see the info panel, click SHOW INFO PANEL.
- Click ADD PRINCIPAL.
- Enter the service account email used by the Datadog Google Cloud integration. You can find your service accounts listed on the left of the Configuration tab in the Google Cloud integration page in Datadog.
Create an asset feed
Run the command below in Cloud Shell or the gcloud CLI to create a Cloud Asset Inventory Feed that sends change events to the Pub/Sub topic created above.
gcloud asset feeds create <FEED_NAME>
--project=<PROJECT_ID>
--pubsub-topic=projects/<PROJECT_ID>/topics/<TOPIC_NAME>
--asset-names=<ASSET_NAMES>
--asset-types=<ASSET_TYPES>
--content-type=<CONTENT_TYPE>
--condition-title=<CONDITION_TITLE>
Update the placeholder values as indicated:
<FEED_NAME>: A descriptive name for the Cloud Asset Inventory Feed.<PROJECT_ID>: Your Google Cloud project ID.
gcloud asset feeds create <FEED_NAME>
--folder=<FOLDER_ID>
--pubsub-topic=projects/<PROJECT_ID>/topics/<TOPIC_NAME>
--asset-names=<ASSET_NAMES>
--asset-types=<ASSET_TYPES>
--content-type=<CONTENT_TYPE>
--condition-title=<CONDITION_TITLE>
Update the placeholder values as indicated:
<FEED_NAME>: A descriptive name for the Cloud Asset Inventory Feed.<FOLDER_ID>: Your Google Cloud folder ID.
gcloud asset feeds create <FEED_NAME>
--organization=<ORGANIZATION_ID>
--pubsub-topic=projects/<PROJECT_ID>/topics/<TOPIC_NAME>
--asset-names=<ASSET_NAMES>
--asset-types=<ASSET_TYPES>
--content-type=<CONTENT_TYPE>
--condition-title=<CONDITION_TITLE>
Update the placeholder values as indicated:
<FEED_NAME>: A descriptive name for the Cloud Asset Inventory Feed.<ORGANIZATION_ID>: Your Google Cloud organization ID.
<TOPIC_NAME>: The name of the Pub/Sub topic linked with theexport-asset-changes-to-datadogsubscription.<ASSET_NAMES>: Comma-separated list of resource full names to receive change events from. Optional if specifyingasset-types.<ASSET_TYPES>: Comma-separated list of asset types to receive change events from. Optional if specifyingasset-names.<CONTENT_TYPE>: Optional asset content type to receive change events from.<CONDITION_TITLE>: Optional title of a condition to apply to the feed.
Datadog recommends setting the asset-types parameter to the regular expression .* to collect changes for all resources.
Note: You must specify at least one value for either the asset-names or asset-types parameter.
See the gcloud asset feeds create reference for the full list of configurable parameters.
Validation
Find your asset change events in the Datadog Event Explorer.
Data Collected
Metrics
See the individual Google Cloud integration pages for metrics.
Cumulative metrics
Cumulative metrics are imported into Datadog with a .delta metric for each metric name. A cumulative metric is a metric where the value constantly increases over time. For example, a metric for sent bytes might be cumulative. Each value records the total number of bytes sent by a service at that time. The delta value represents the change since the previous measurement.
For example:
gcp.gke.container.restart_count is a CUMULATIVE metric. While importing this metric as a cumulative metric, Datadog adds the gcp.gke.container.restart_count.delta metric which includes the delta values (as opposed to the aggregate value emitted as part of the CUMULATIVE metric). See Google Cloud metric kinds for more information.
Events
All service events generated by your Google Cloud Platform are forwarded to your Datadog Events Explorer.
Service Checks
The Google Cloud Platform integration does not include any service checks.
Tags
Tags are automatically assigned based on a variety of Google Cloud Platform and Google Compute Engine configuration options. The project_id tag is added to all metrics. Additional tags are collected from the Google Cloud Platform when available, and varies based on metric type.
Additionally, Datadog collects the following as tags:
- Any hosts with
<key>:<value>labels. - Custom labels from Google Pub/Sub, GCE, Cloud SQL, and Cloud Storage.
Troubleshooting
Incorrect metadata for user defined gcp.logging metrics?
For non-standard gcp.logging metrics, such as metrics beyond Datadog’s out of the box logging metrics, the metadata applied may not be consistent with Google Cloud Logging.
In these cases, the metadata should be manually set by navigating to the metric summary page, searching and selecting the metric in question, and clicking the pencil icon next to the metadata.
Need help? Contact Datadog support.
Further reading
Additional helpful documentation, links, and articles:
