Skip to content
New issue

Have a question about this project? Sign up for a free GitHub account to open an issue and contact its maintainers and the community.

By clicking “Sign up for GitHub”, you agree to our terms of service and privacy statement. We’ll occasionally send you account related emails.

Already on GitHub? Sign in to your account

Candlestick series bug with small timeframe #386

Open
Morgiver opened this issue Dec 16, 2020 · 7 comments
Open

Candlestick series bug with small timeframe #386

Morgiver opened this issue Dec 16, 2020 · 7 comments
Labels
category: plots related to plots priority: medium medium priority state: pending not addressed yet state: question Further information is requested type: bug bug

Comments

@Morgiver
Copy link

Morgiver commented Dec 16, 2020

Version of Dear PyGui:
Version: 0.6.42

OS
Operating System: Windows 10

My Issue/Question
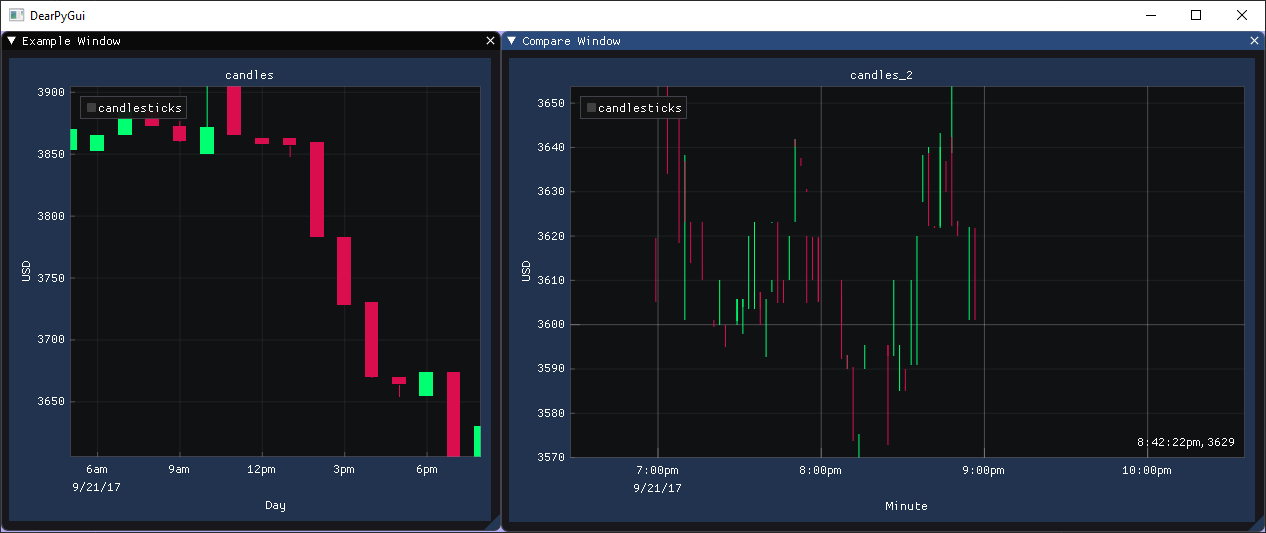
I can't have a good looking Candlestick series in 1 minute timeframe.
Candles seems to be bugged, don't really understand why.

Screenshots/Video
candlestick-bugged

Configuration plot are the same, the source of data is checked. Is there something i forget ? Like a parameter to set or somethin else ?

Portion of code :

# [...]
    with window("Example Window", width=500, height=500, y_pos=0, x_pos=0):
        add_plot("candles", anti_aliased=True, xaxis_time=True, x_axis_name="Day", y_axis_name="USD")
        add_candle_series("candles", "candlesticks", cdls["date"], cdls["open"], cdls["high"],
                          cdls["low"], cdls["close"])

    with window("Compare Window", width=500, height=500, y_pos=0, x_pos=501):
        add_plot("candles_2", anti_aliased=True, xaxis_time=True, x_axis_name="Minute", y_axis_name="USD")
        add_candle_series("candles_2", "candlesticks", cdls_1m["date"], cdls_1m["open"], cdls_1m["high"],
                          cdls_1m["low"], cdls_1m["close"])
# [...]
@MisterrNibble
Copy link

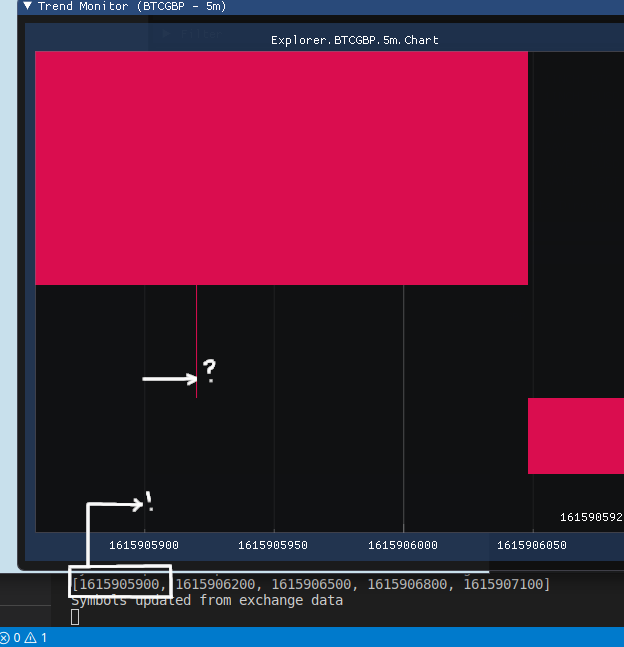
There seems to be some drift in float interpretation between python and the series api. Even with large time frames, the klines don't sit on grid-lines when their values should match exactly. When the time frames are small, the issue compounds, and gets to a point where k-lines are overlapping, in the wrong place entirely. Some candlesticks get drawn on top of each other even if the date given to them is verifiable as different.

In the attached diagram, 1615905900 is being passed as a float list to the series, and while the x-axis can cope with this interval nicely, the candlesticks all have precision drift.

drift

@renejr-zeus
Copy link

renejr-zeus commented Apr 12, 2021

Is there some way around this?
I thought I was doing something wrong... then I realize that candles below 5minutes I always get the same bug...

@hoffstadt
Copy link
Owner

Not yet. We are working on this issue for 0.7

@renejr-zeus
Copy link

Not yet. We are working on this issue for 0.7

Nice! Thanks for reply and the good work you guys are doing! =)

@hoffstadt
Copy link
Owner

Can we confirm this is present in 0.8?

@hoffstadt hoffstadt added the state: question Further information is requested label Jun 30, 2021
@Morgiver
Copy link
Author

Morgiver commented Jul 2, 2021

UPDATE:
It's working !

    dates = df['date'].to_numpy()
    min_dates = min(dates)
    max_dates = max(dates)
    opens = df['open'].to_numpy()
    highs = df['high'].to_numpy()
    max_highs = max(highs)
    lows = df['low'].to_numpy()
    min_lows = min(lows)
    closes = df['close'].to_numpy()

    with window(label="Trader", width=500, height=500, pos=[0, 0]) as main_window:
        with plot(label="Candles Plot", width=-1, height=-1) as plot_id:
            add_plot_legend()
            add_plot_axis(mvXAxis, label="Dates", time=True)
            set_axis_limits(last_item(), min_dates, max_dates)
            add_plot_axis(mvYAxis, label="Prices")
            set_axis_limits(last_item(), min_lows, max_highs)
            add_candle_series(dates=dates, opens=opens, highs=highs, lows=lows, closes=closes, label="Candlesticks",
                              parent=last_item())

    set_primary_window(main_window, True)
    start_dearpygui()

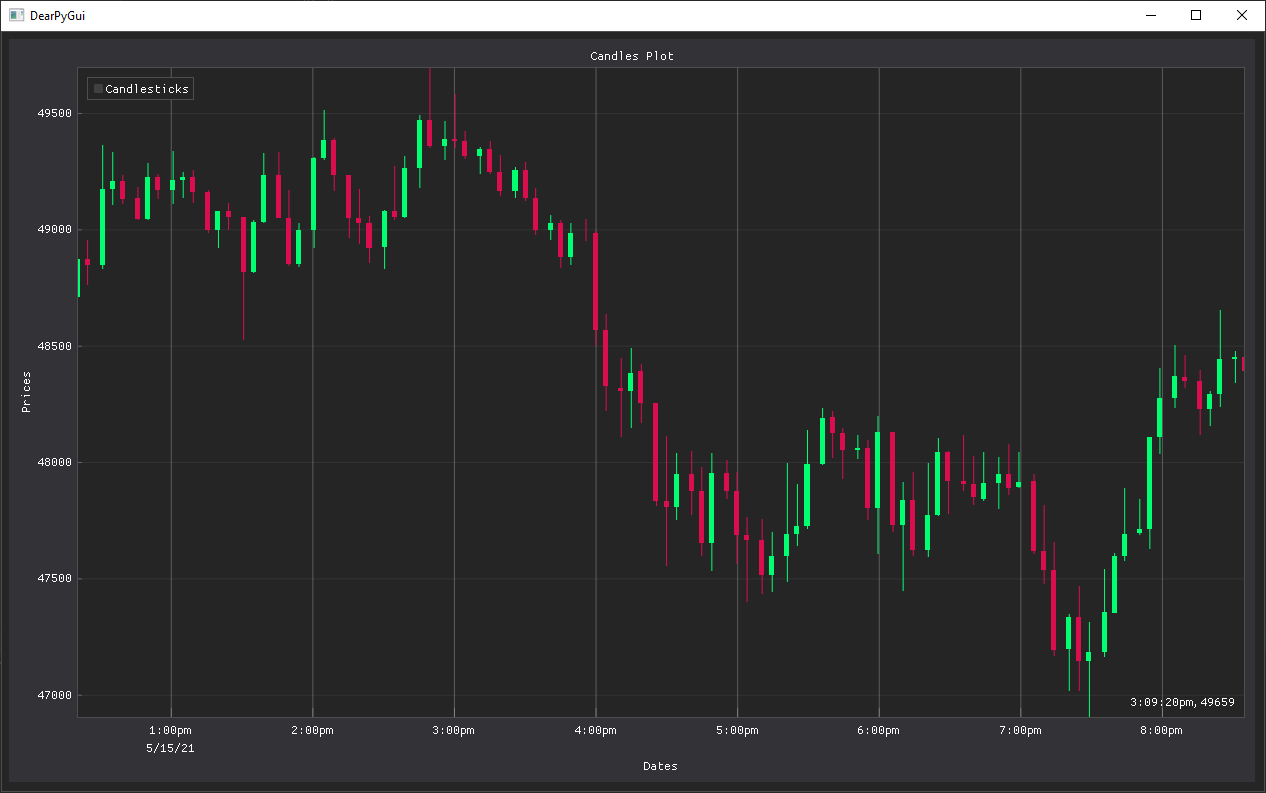
Result with 5 minutes timeframe :
image

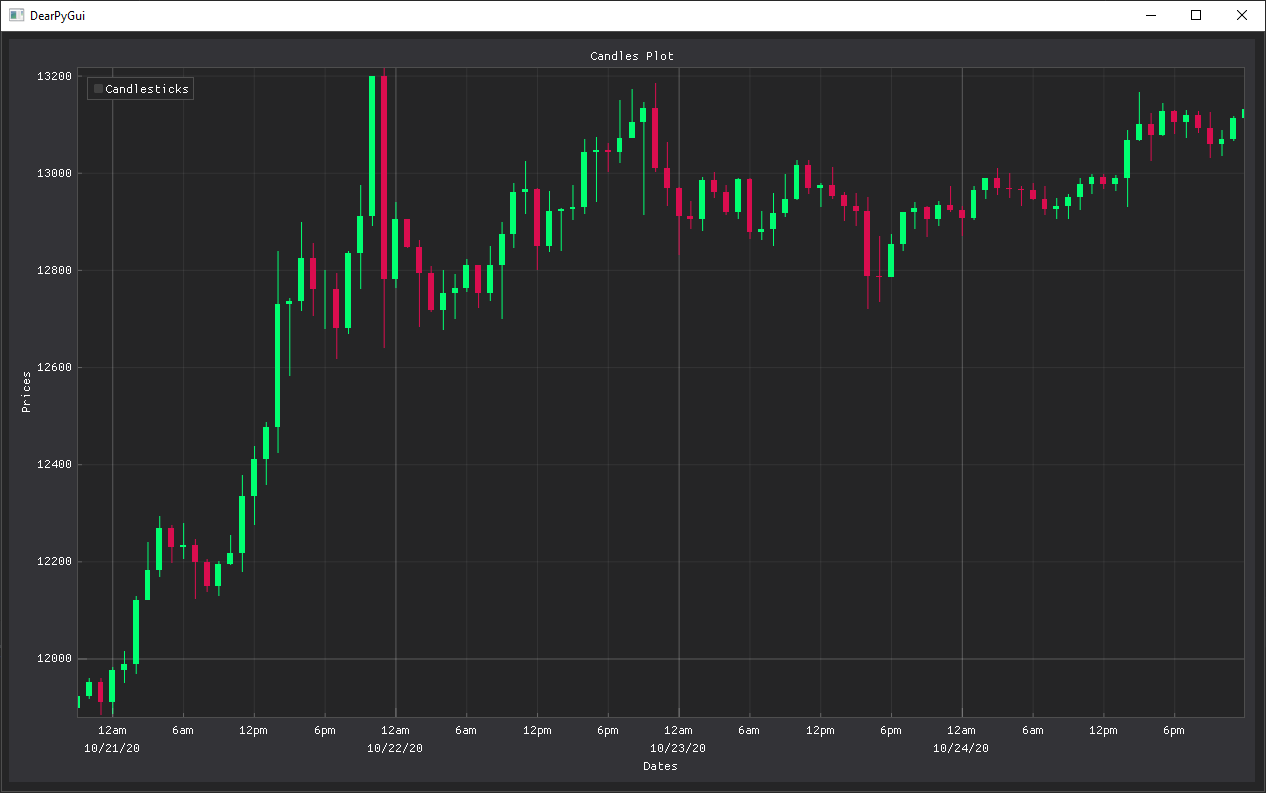
Result with 1 hour timeframe :
image

@Morgiver
Copy link
Author

Morgiver commented Jul 3, 2021

If I can suggest some improvements:

  • The wicks are not centered in relation to the bodies of the candles
  • I have the impression that when the price difference between the open and the close is too small or even just equal, some candles do not have their closed position (the small horizontal bar) leaving just a wick alone.
  • It may be due to my lack of knowledge of DearPyGUI, but I have the impression that the dates are not displayed in detail, moreover the cursor (the onhover vertical highlight) does not follow all the dates, it only displays on 12am
Sign up for free to join this conversation on GitHub. Already have an account? Sign in to comment
Labels
category: plots related to plots priority: medium medium priority state: pending not addressed yet state: question Further information is requested type: bug bug
4 participants