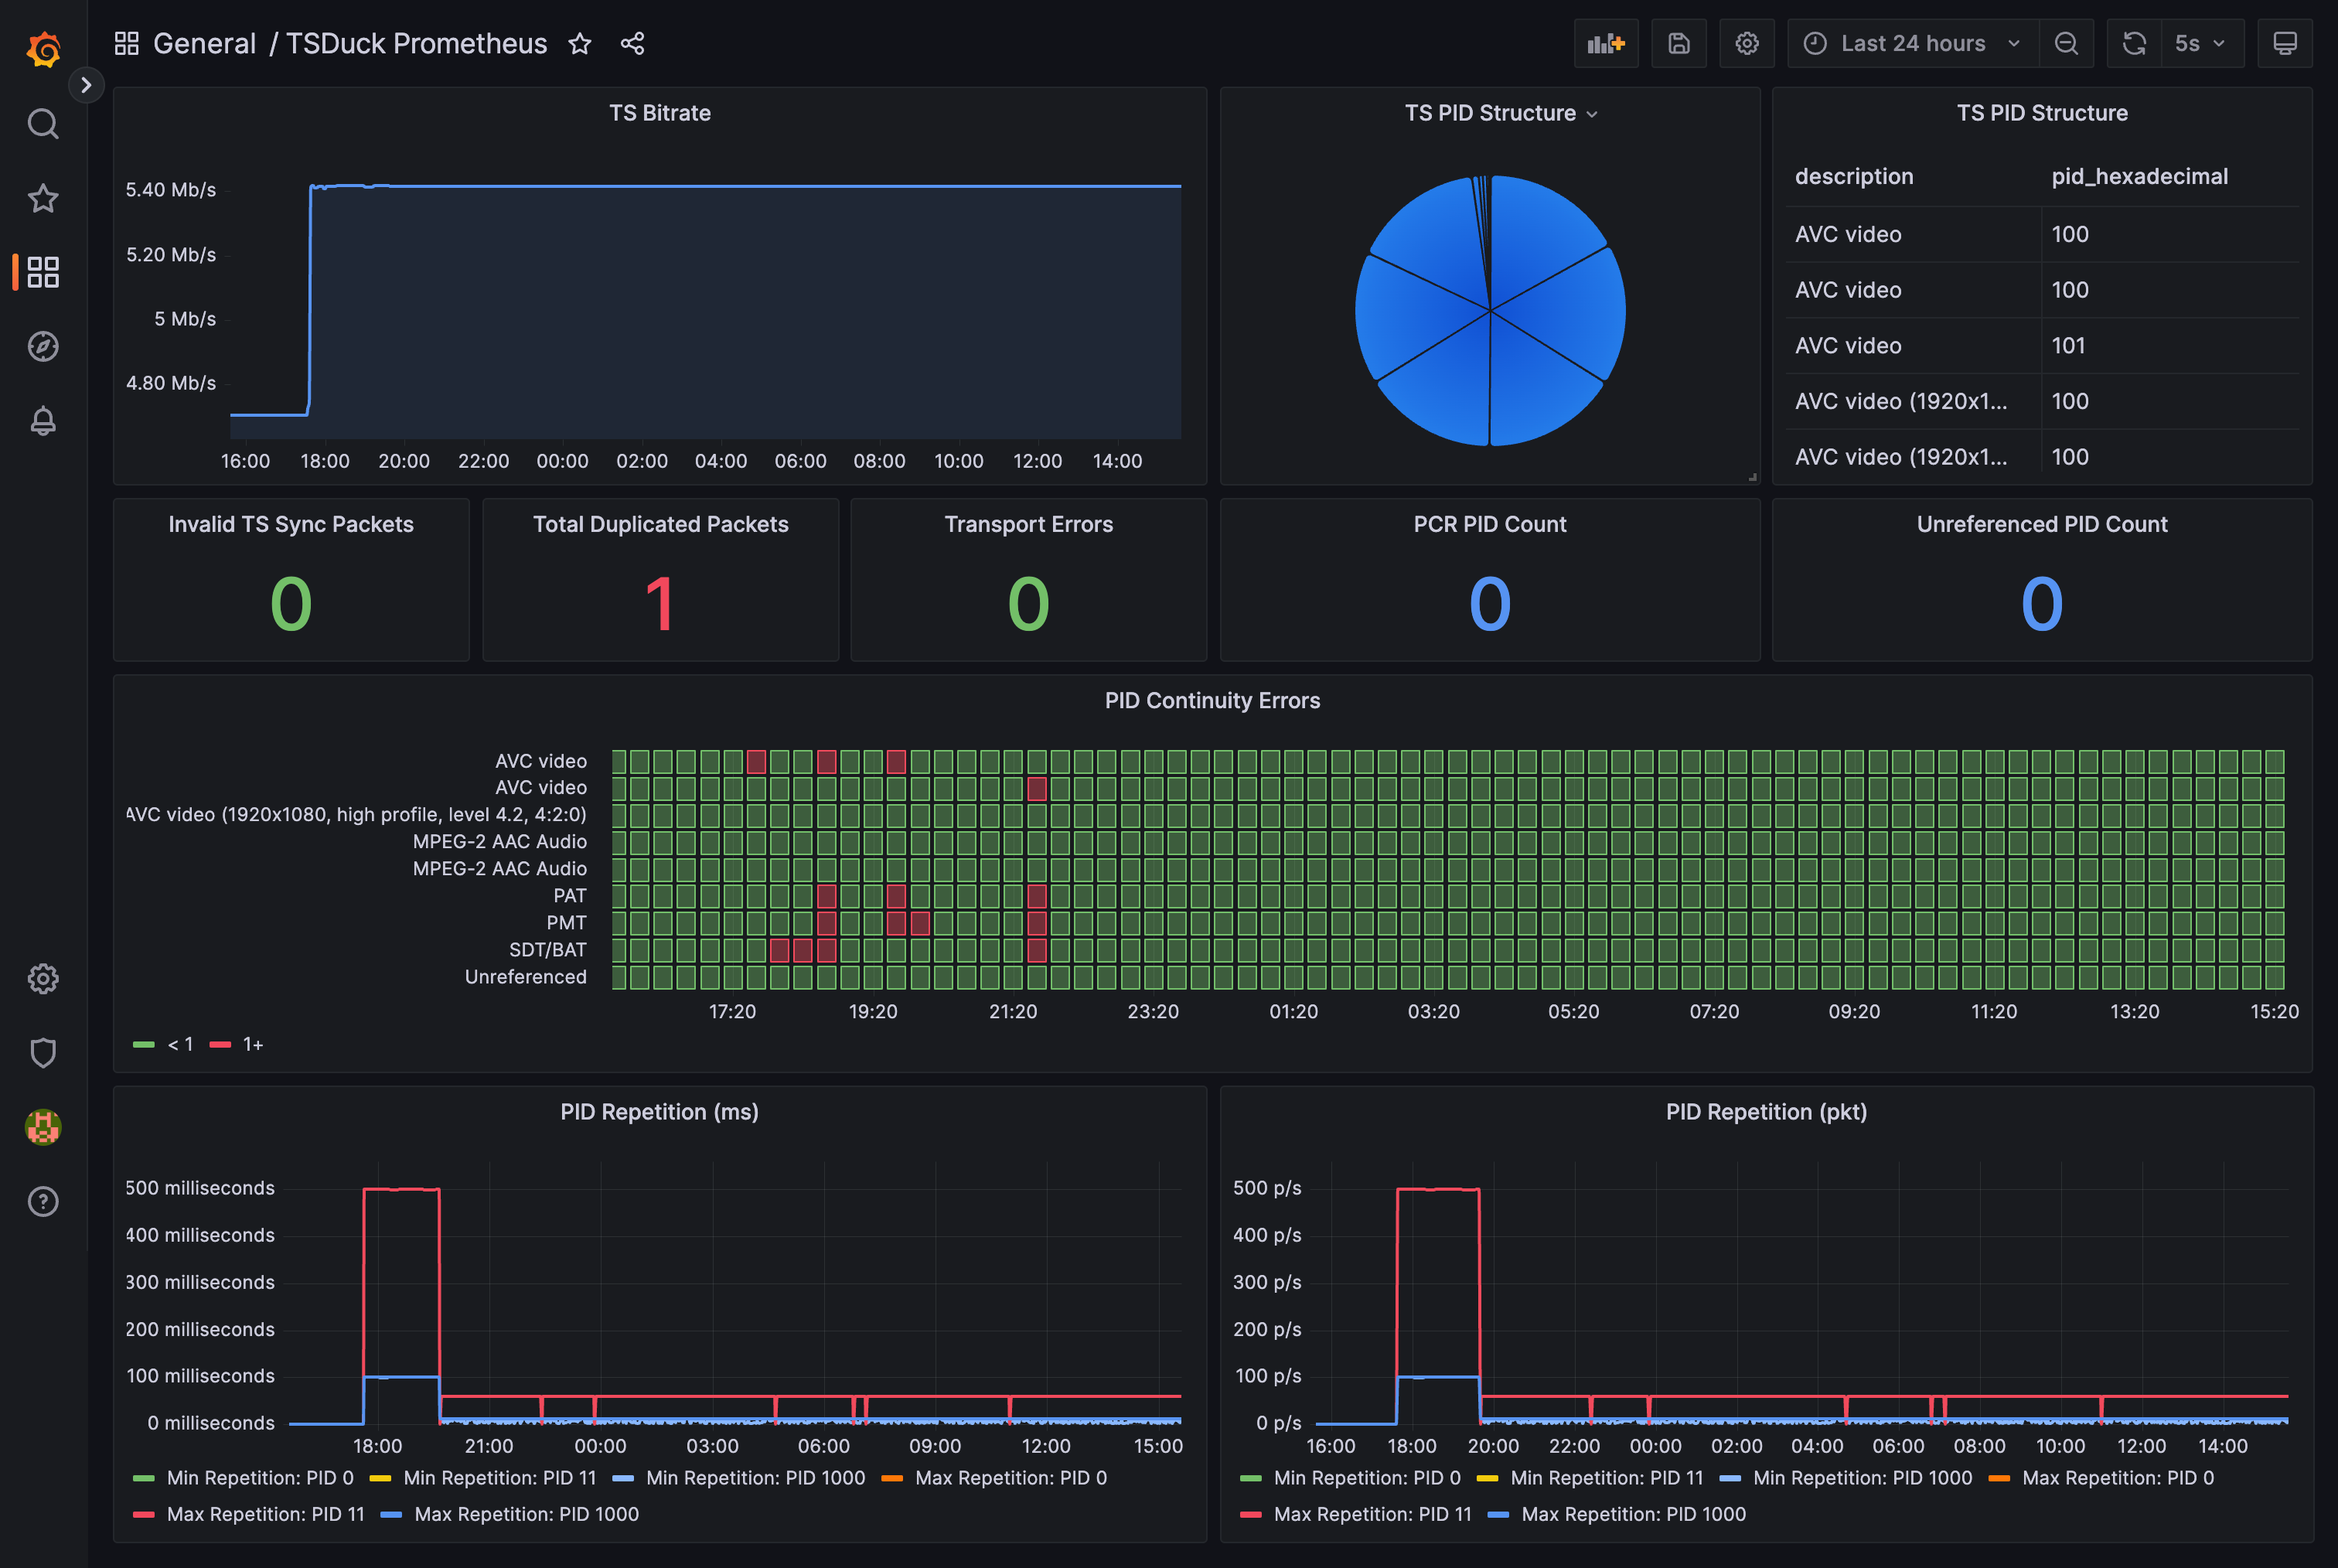
TSDuck Prometheus is a tool to export values from a TSDuck analyser pipeline into Prometheus, to enable you to build realtime Grafana dashboards for monitoring of MPEG-TS transport streams
The metrics exported try to cover most of ETR290 Priority 1
Make sure you have TSDuck and Go version >1.18 installed, and can run 'tsp' commands on your machine. Clone this repo and build using the following commands...
go mod tidy
go build -o /tsduck-prometheus
./tsduck-prometheus 225.0.0.1:20000,172.0.0.1,My_Service
A Dockerfile is included on this repository, it's not perfect at the moment (the image size could likely be smaller) but it works
Local to the Dockerfile, the following commands can be used to get started using Docker with host networking mode
docker build -t tsduck-prometheus .
docker run -d --network host tsduck-prometheus 225.0.0.1:20000,172.0.0.1,My_Service
An example dashboard is included on the repository to get you started (see dashboard.json)
